-
AeroGCS Enterprise User Manual
4. Dashboard
Your Central Hub for Real-Time Drone Operations
The AeroGCS Enterprise Dashboard is the command center for your drone operations. It provides a unified, real-time view of flight metrics, drone performance, project plans, pilot statistics, and critical alerts — all designed to help you operate with maximum efficiency and awareness.
4.1 Dashboard Layout
Upon logging in, users are directed to the Dashboard — a well-organised visual overview of current and historical mission data.

The dashboard is composed of the following key sections:
- Dashboard Time Range Filter
- Summary Cards
- Drone Performance Chart
- Weekly Flights Graph
- Recent Flights Table
- Recent Plans Table
- Flight Replay Panel (Fly View)
- Top Bar Icons for notifications, error logs, and profile management
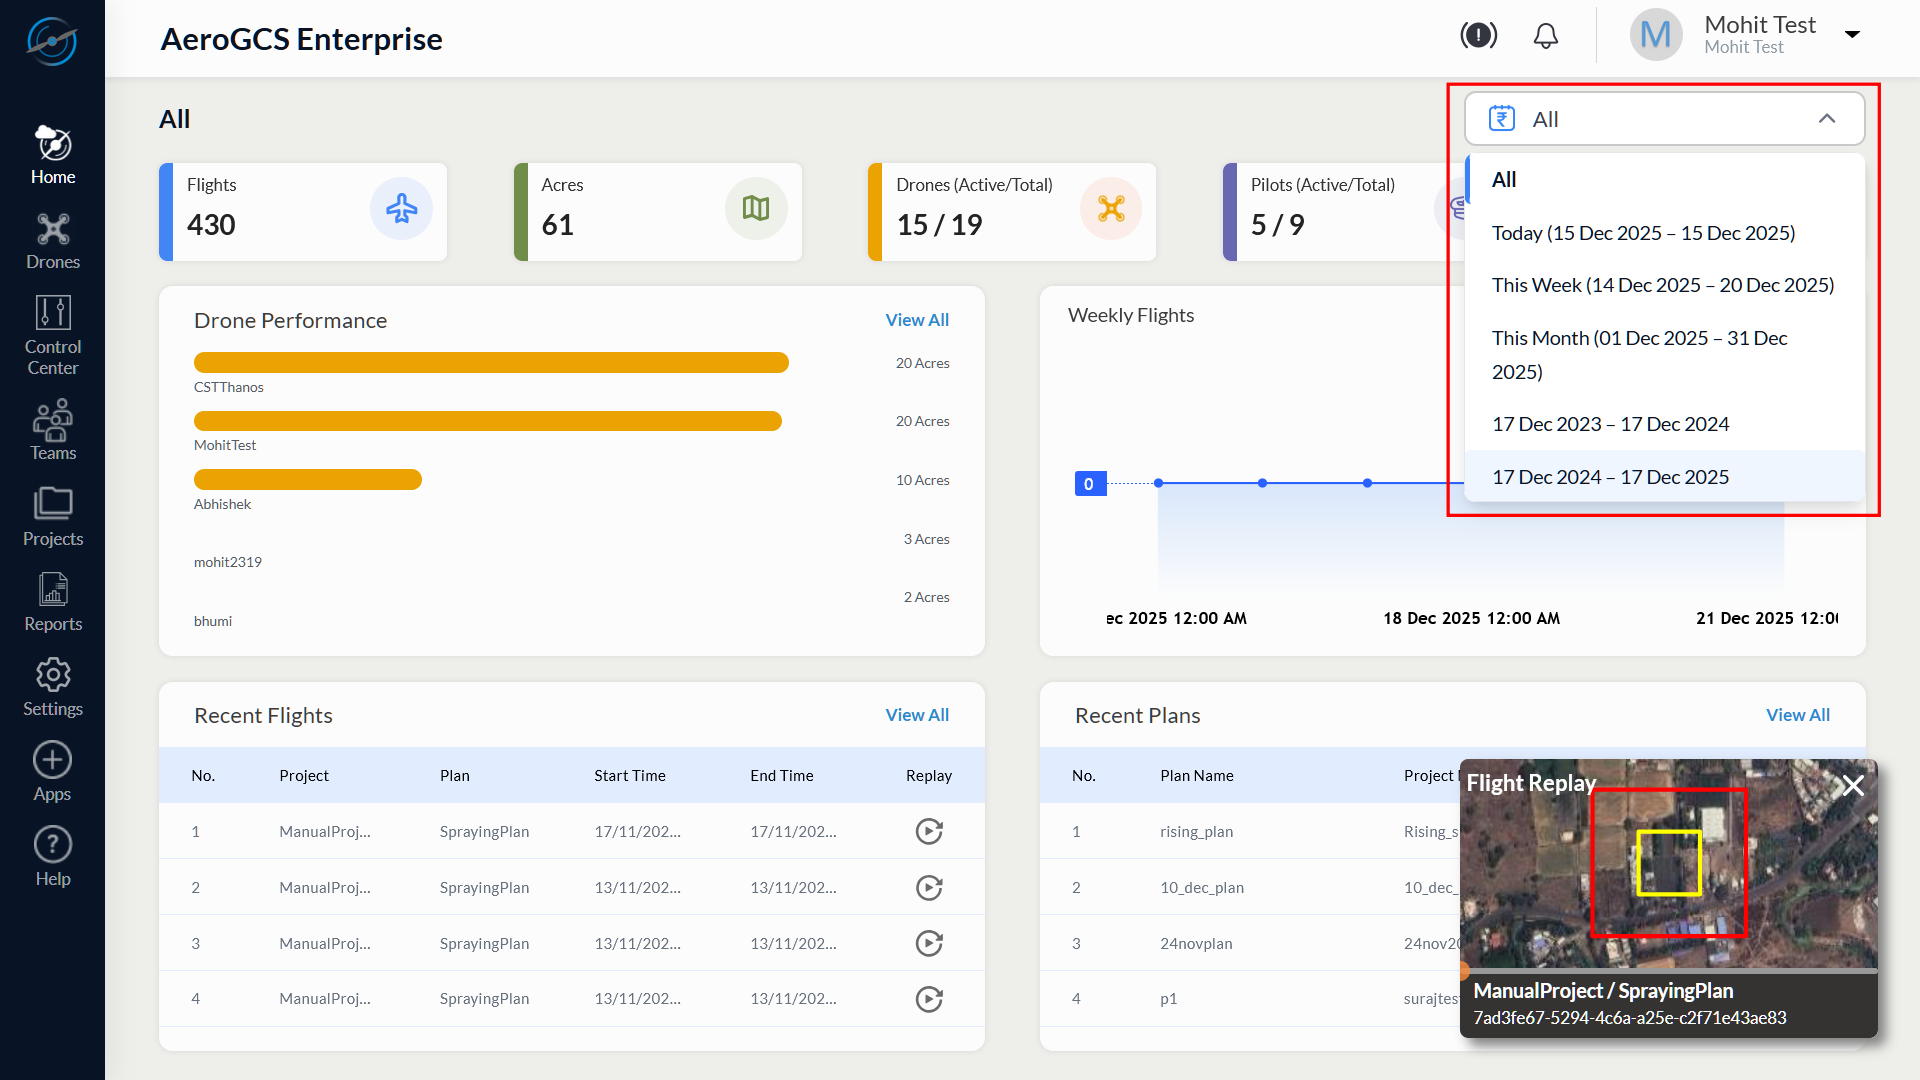
The Dashboard Time Range Filter controls the data displayed across all dashboard components.
The Dashboard Time Range Filter allows the user to view dashboard data for a selected time period.
Location
- The filter is located at the top-right corner of the Dashboard, above the Summary Cards.
Available Options (as displayed in the UI)
The dropdown list may contain the following options:
- All
- Today (for example: 15 Dec 2025 – 15 Dec 2025)
- This Week (for example: 14 Dec 2025 – 20 Dec 2025)
- This Month (for example: 01 Dec 2025 – 31 Dec 2025)
- Date-range entries, such as:
- 17 Dec 2023 – 17 Dec 2024
- 17 Dec 2024 – 17 Dec 2025
- 01 Apr 2025 – 31 Mar 2026
Behavior After Selection
After a time range is selected:
- The Dashboard refreshes automatically.
- All dashboard sections display data limited to the selected time range.
- No manual refresh action is required.
⚠️ Important
The selected time range applies only to the Dashboard view.
It does not change data filters in other modules such as Projects, Drones, Reports, or Settings.
Depending on the active account plan, the data displayed on the Dashboard may be subject to availability limits.
Behavior During Trial or Limited Access
When the platform is accessed under a trial or limited plan:
- Dashboard metrics may display data for a restricted time period.
- Historical flight data beyond the allowed retention period may not appear.
- Live Drone count may remain zero even when drones are registered.
- Certain operational features remain visible but may not provide live or extended data.
These limits affect data visibility only and do not indicate system malfunction.
⚠️ Note
Data availability and feature access automatically update when the account plan is upgraded. No reconfiguration or data migration is required by the user.
4.2 Summary Cards
Displayed at the top, these cards offer at-a-glance metrics for your organisation’s flight operations.
| Card | Description |
| Flights | Total completed drone flights |
| Acres | Total area covered in all missions (in acres) |
| Drones | Number of registered drones |
| Pilots | Number of active pilots or users |
| Live Drones | Number of drones currently in active flight |
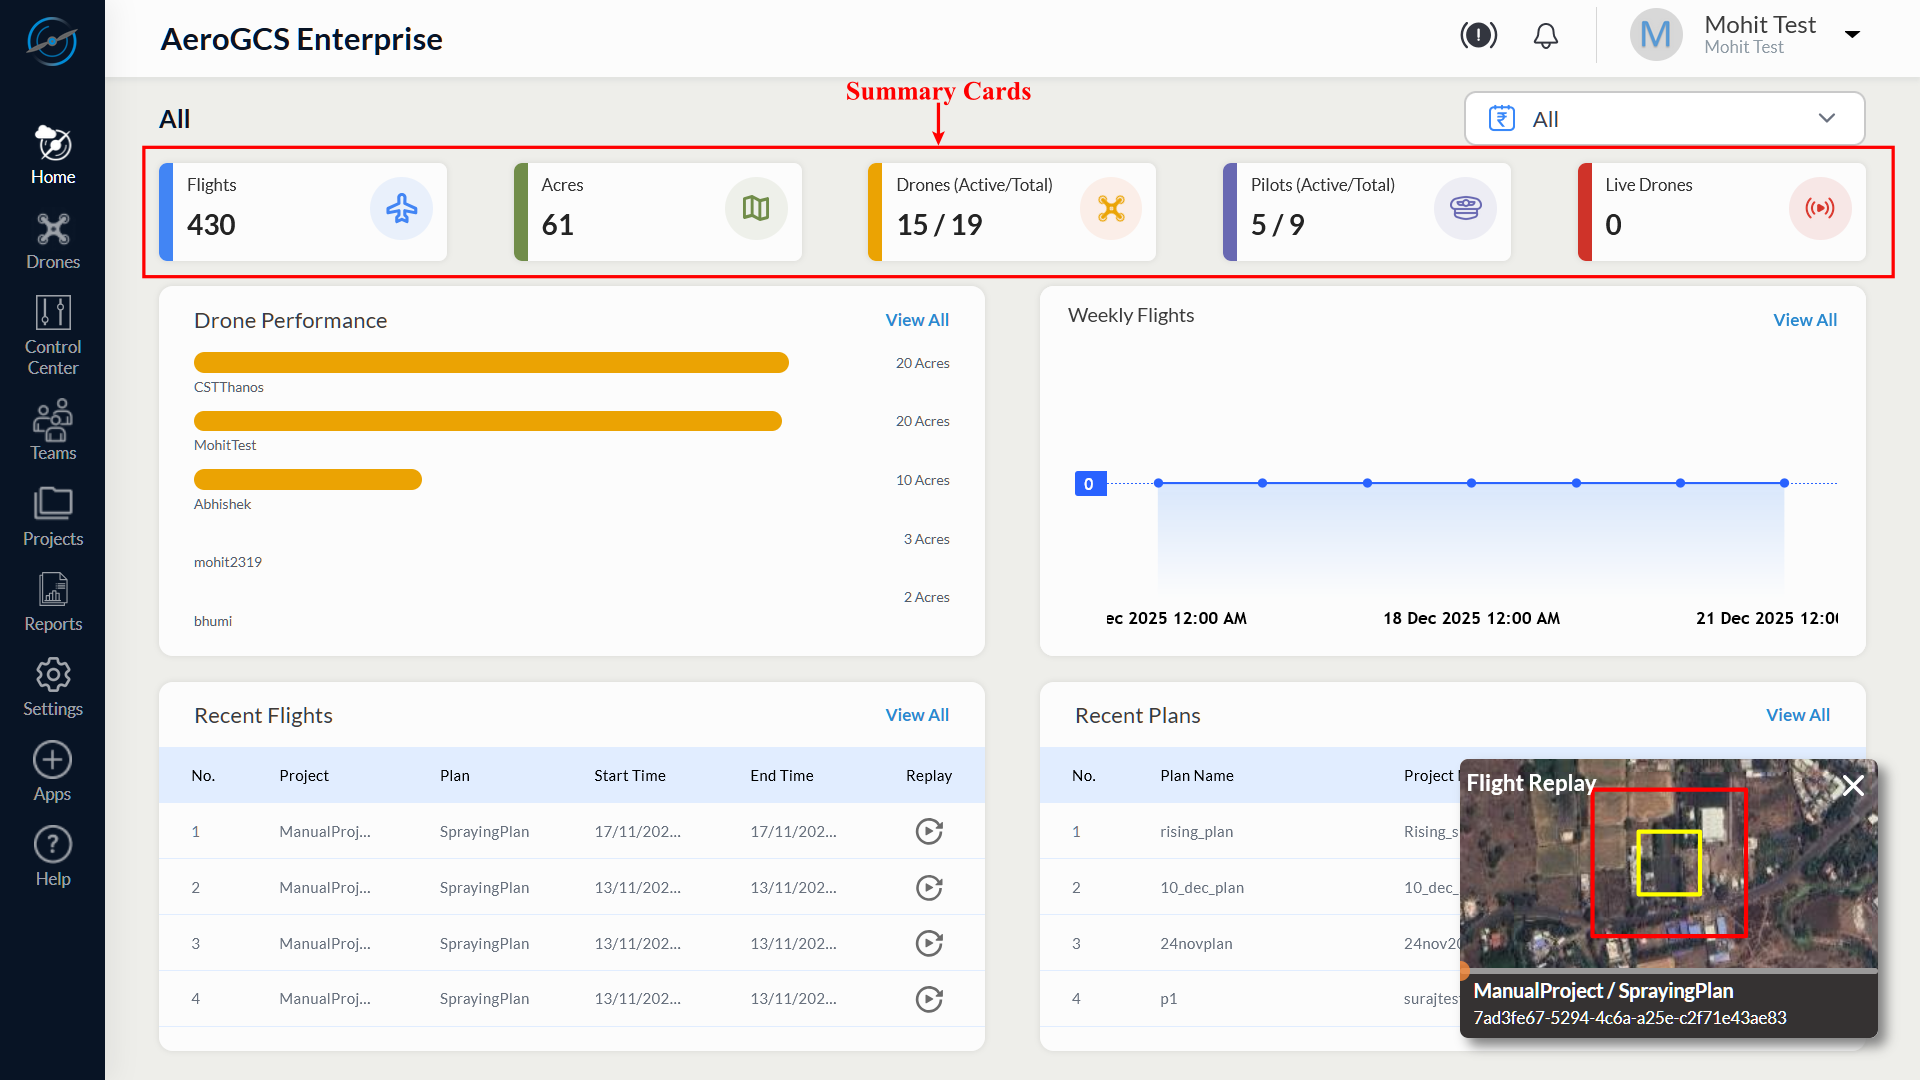
The values shown in the Summary Cards reflect data only for the currently selected Dashboard Time Range.
4.3 Drone Performance
This section displays the total flight time logged by each drone in the system, visualised as a horizontal bar chart.
| Data Shown | Description |
| Drone Names | As registered in the system |
| Flight Duration | In hours (e.g., 28.03 hours) |
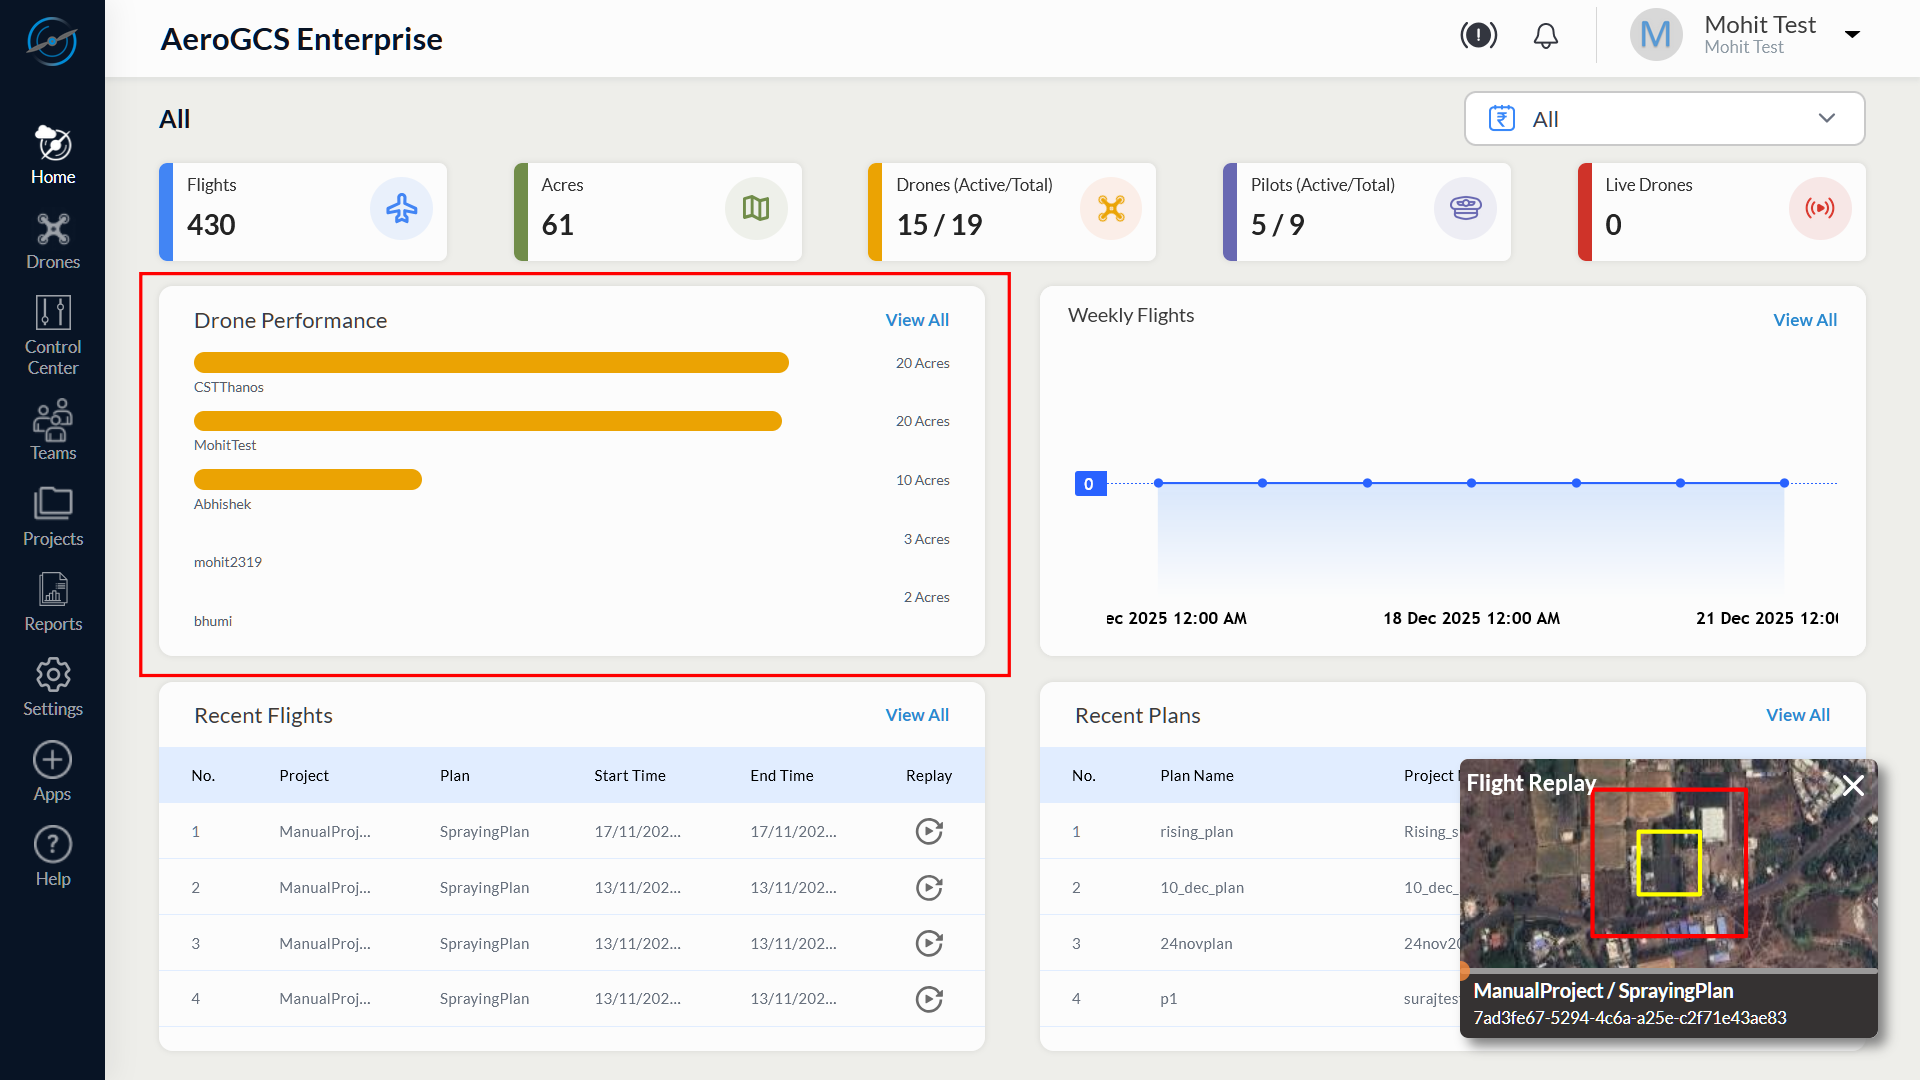
The Drone Performance panel updates according to the selected Dashboard Time Range and displays drone activity data limited to that period.
Use Case: Identify overused drones for maintenance and balance operational load across available units.
4.4 Weekly Flights
A line graph showcasing the number of drone flights per day for the current week.
Axis | Data Presented |
X-Axis | Daily timeline (by date) |
Y-Axis | Number of flights flown |
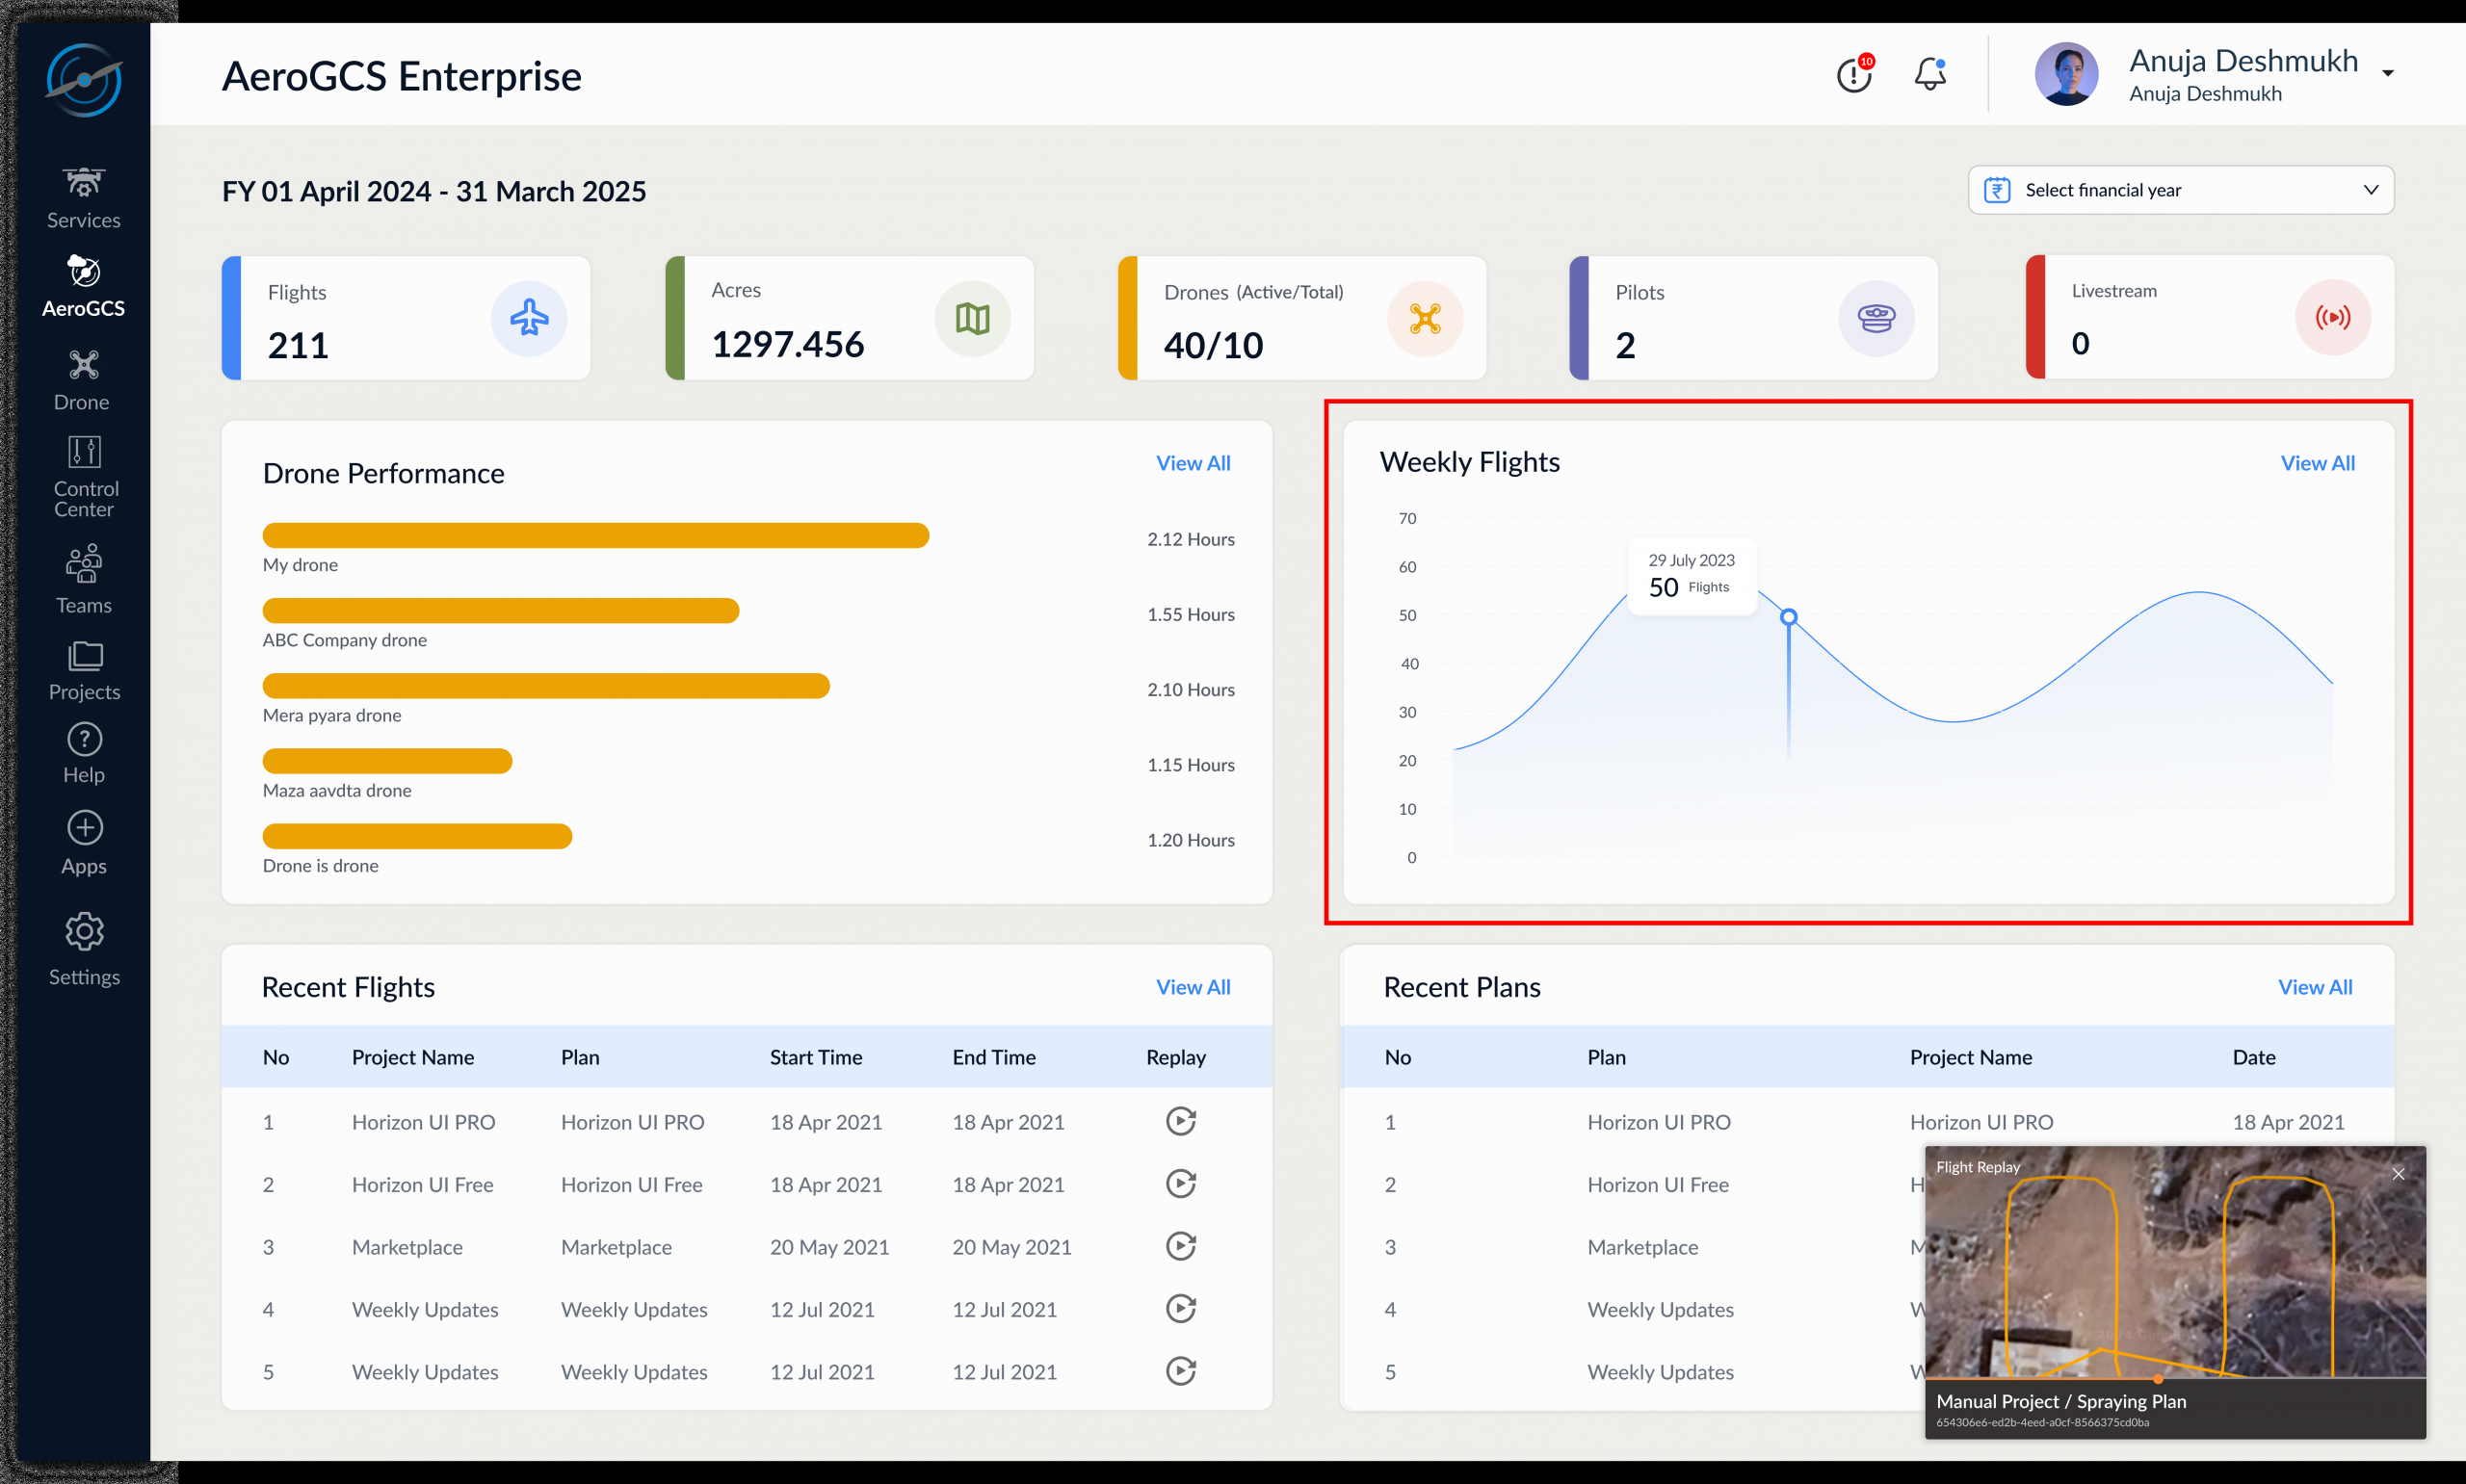
The Weekly Flights graph displays flight activity within the selected Dashboard Time Range. If no flights are available for the selected period, the graph displays zero activity.
⚠️ A sharp drop or flat line may indicate no flight activity or data sync issues.
4.5 Recent Flights
Displays a table of the most recently completed flights including project details and a quick link to view the replay via Fly View.
Column | Description |
No. | Serial number |
Project | Project name linked to the flight |
Plan | Type of plan used (e.g., SprayingPlan) |
Start Time | Timestamp when the flight began |
End Time | Timestamp when the flight ended |
Replay | ⟳ icon to open the Fly View mission replay interface |
Click the replay icon to inspect historical telemetry and map-based flight playback.
The Recent Flights table lists only flights that occurred within the selected Dashboard Time Range.
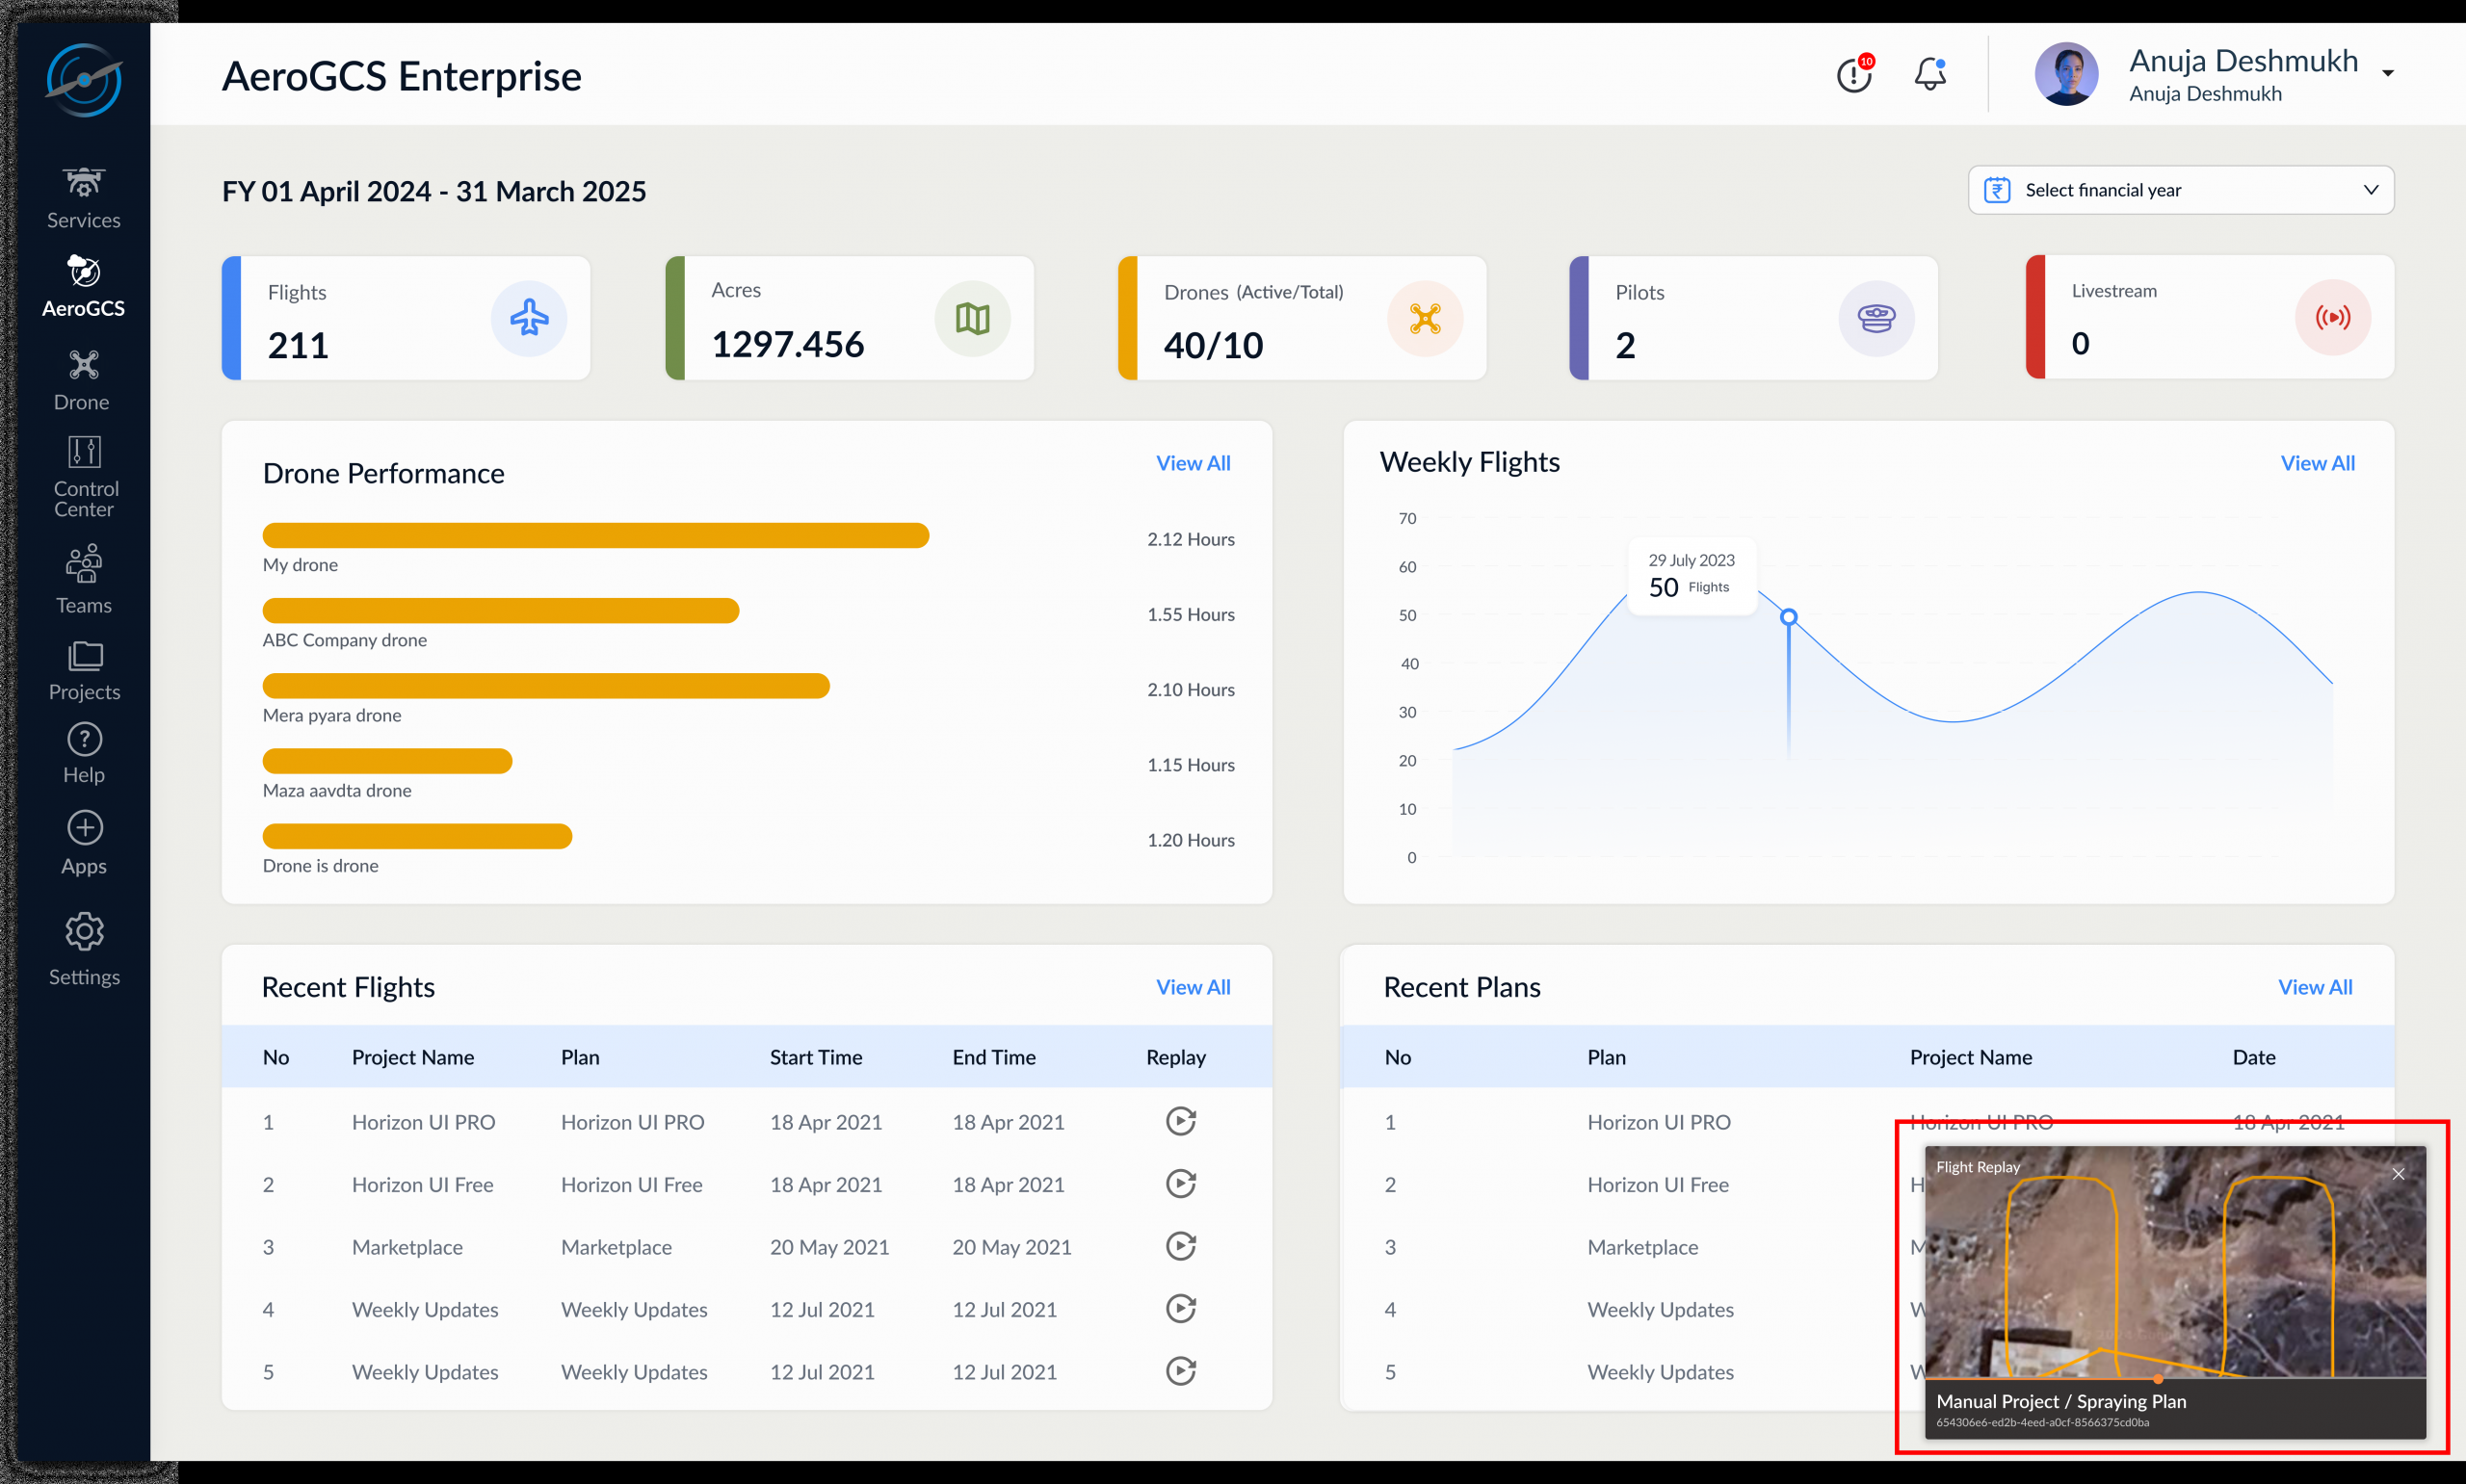
4.6 Flight Replay (Fly View)
Clicking Replay opens Fly View, a satellite-map-based interface that allows users to visually inspect a completed flight with synchronized telemetry playback.
Key Capabilities of Fly View:
Feature | Description |
Live Path Playback | Drone route shown on satellite map |
Mission Info Header | Flight ID, Plan Name, Project Name |
Timeline Slider | Scrub through the flight timeline to review events |
Telemetry Display | Real-time stats on GPS, heading, altitude, flow, etc. |
Replay Controls | Play, pause, restart |
System Messages | Logs like “Disarming Motors” or streaming warnings |
Right Panel Log List | Quick access to recent flight replays |
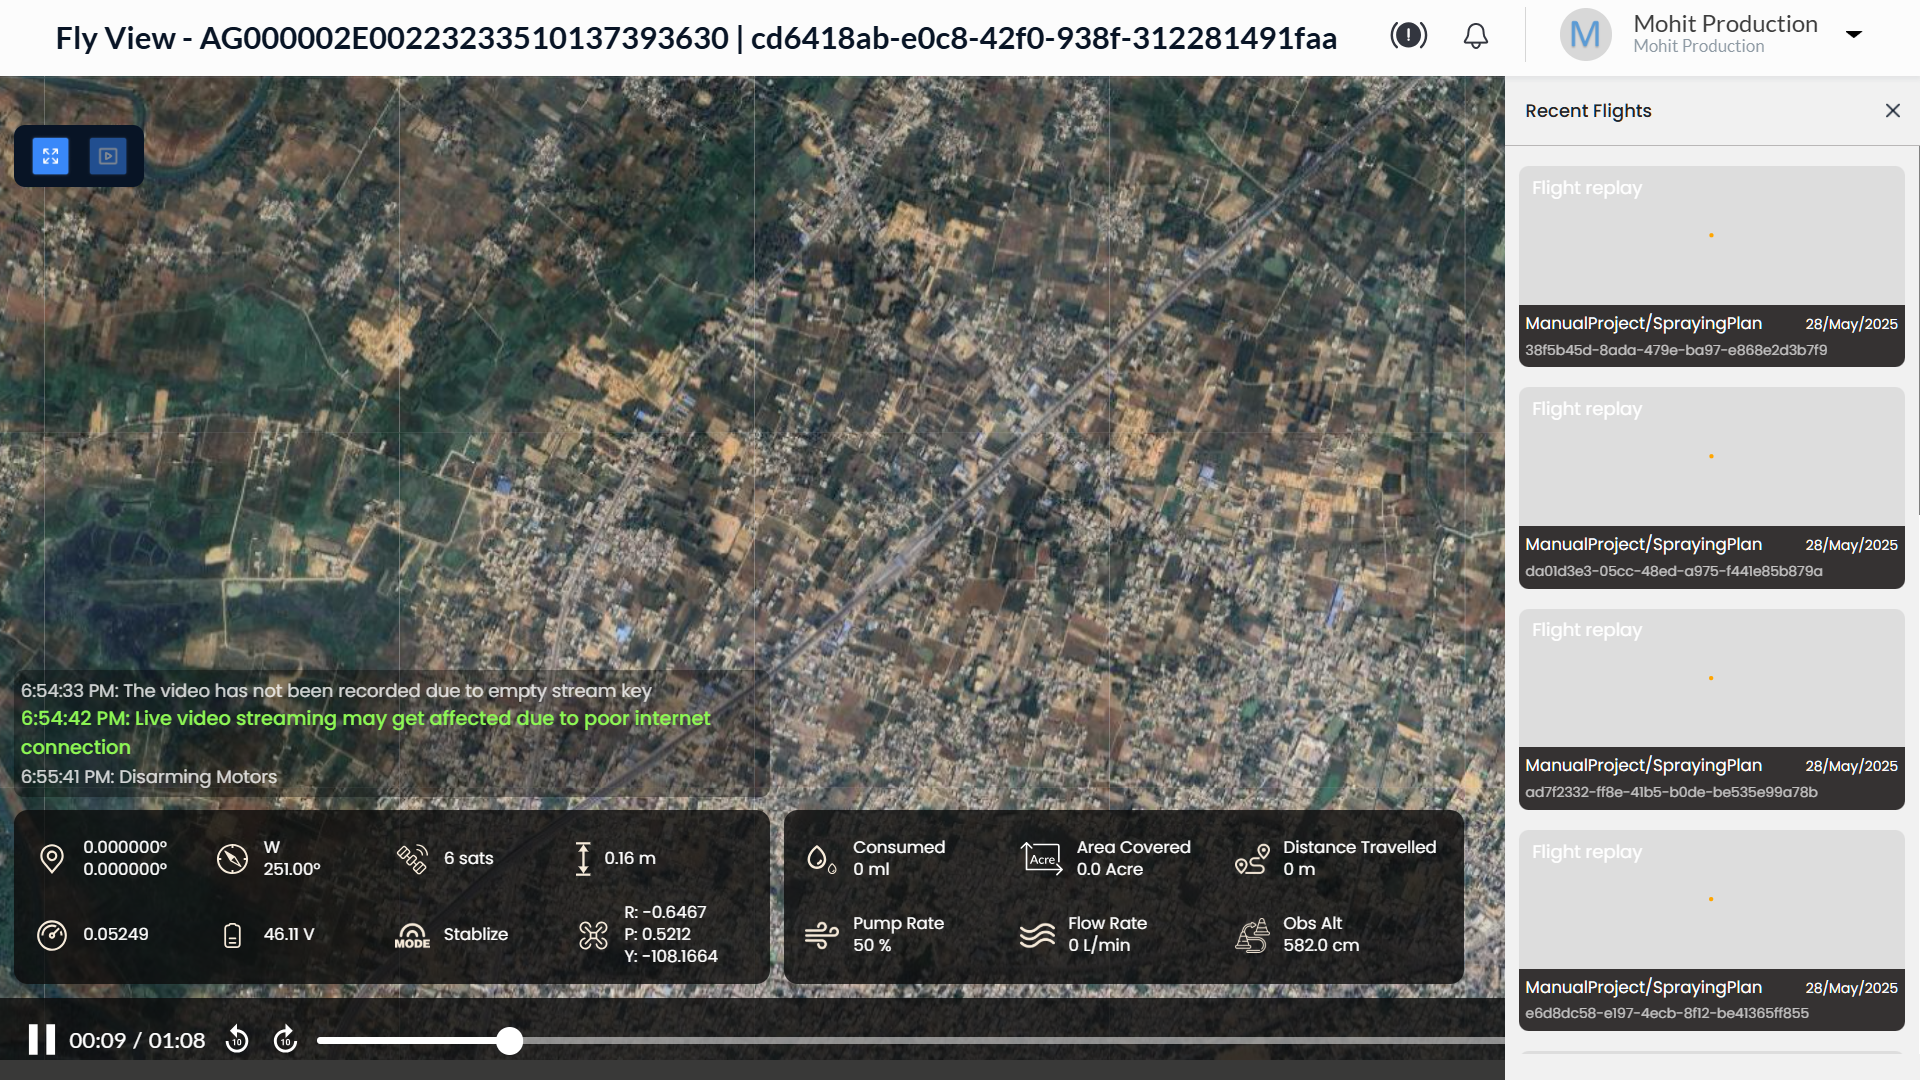
Telemetry Details Shown:
- GPS Coordinates (Lat, Long)
- Drone Orientation: Roll, Pitch, Yaw
- Flight Mode (e.g. Stabilize)
- Battery Voltage
- Area Covered
- Distance Travelled
- Pump & Flow Rate (for spraying)
- Obstacle Altitude
- Satellite Lock (e.g. 7 sats)
Use Fly View for flight audits, validation, troubleshooting, and team reviews.
4.7 Recent Plans
Displays the latest flight plans created within the platform or synced from AeroGCS.
Column | Description |
No. | Serial index |
Plan Name | Custom plan name (e.g., plan1) |
Project Name | Related project |
Date | Date of creation or sync |
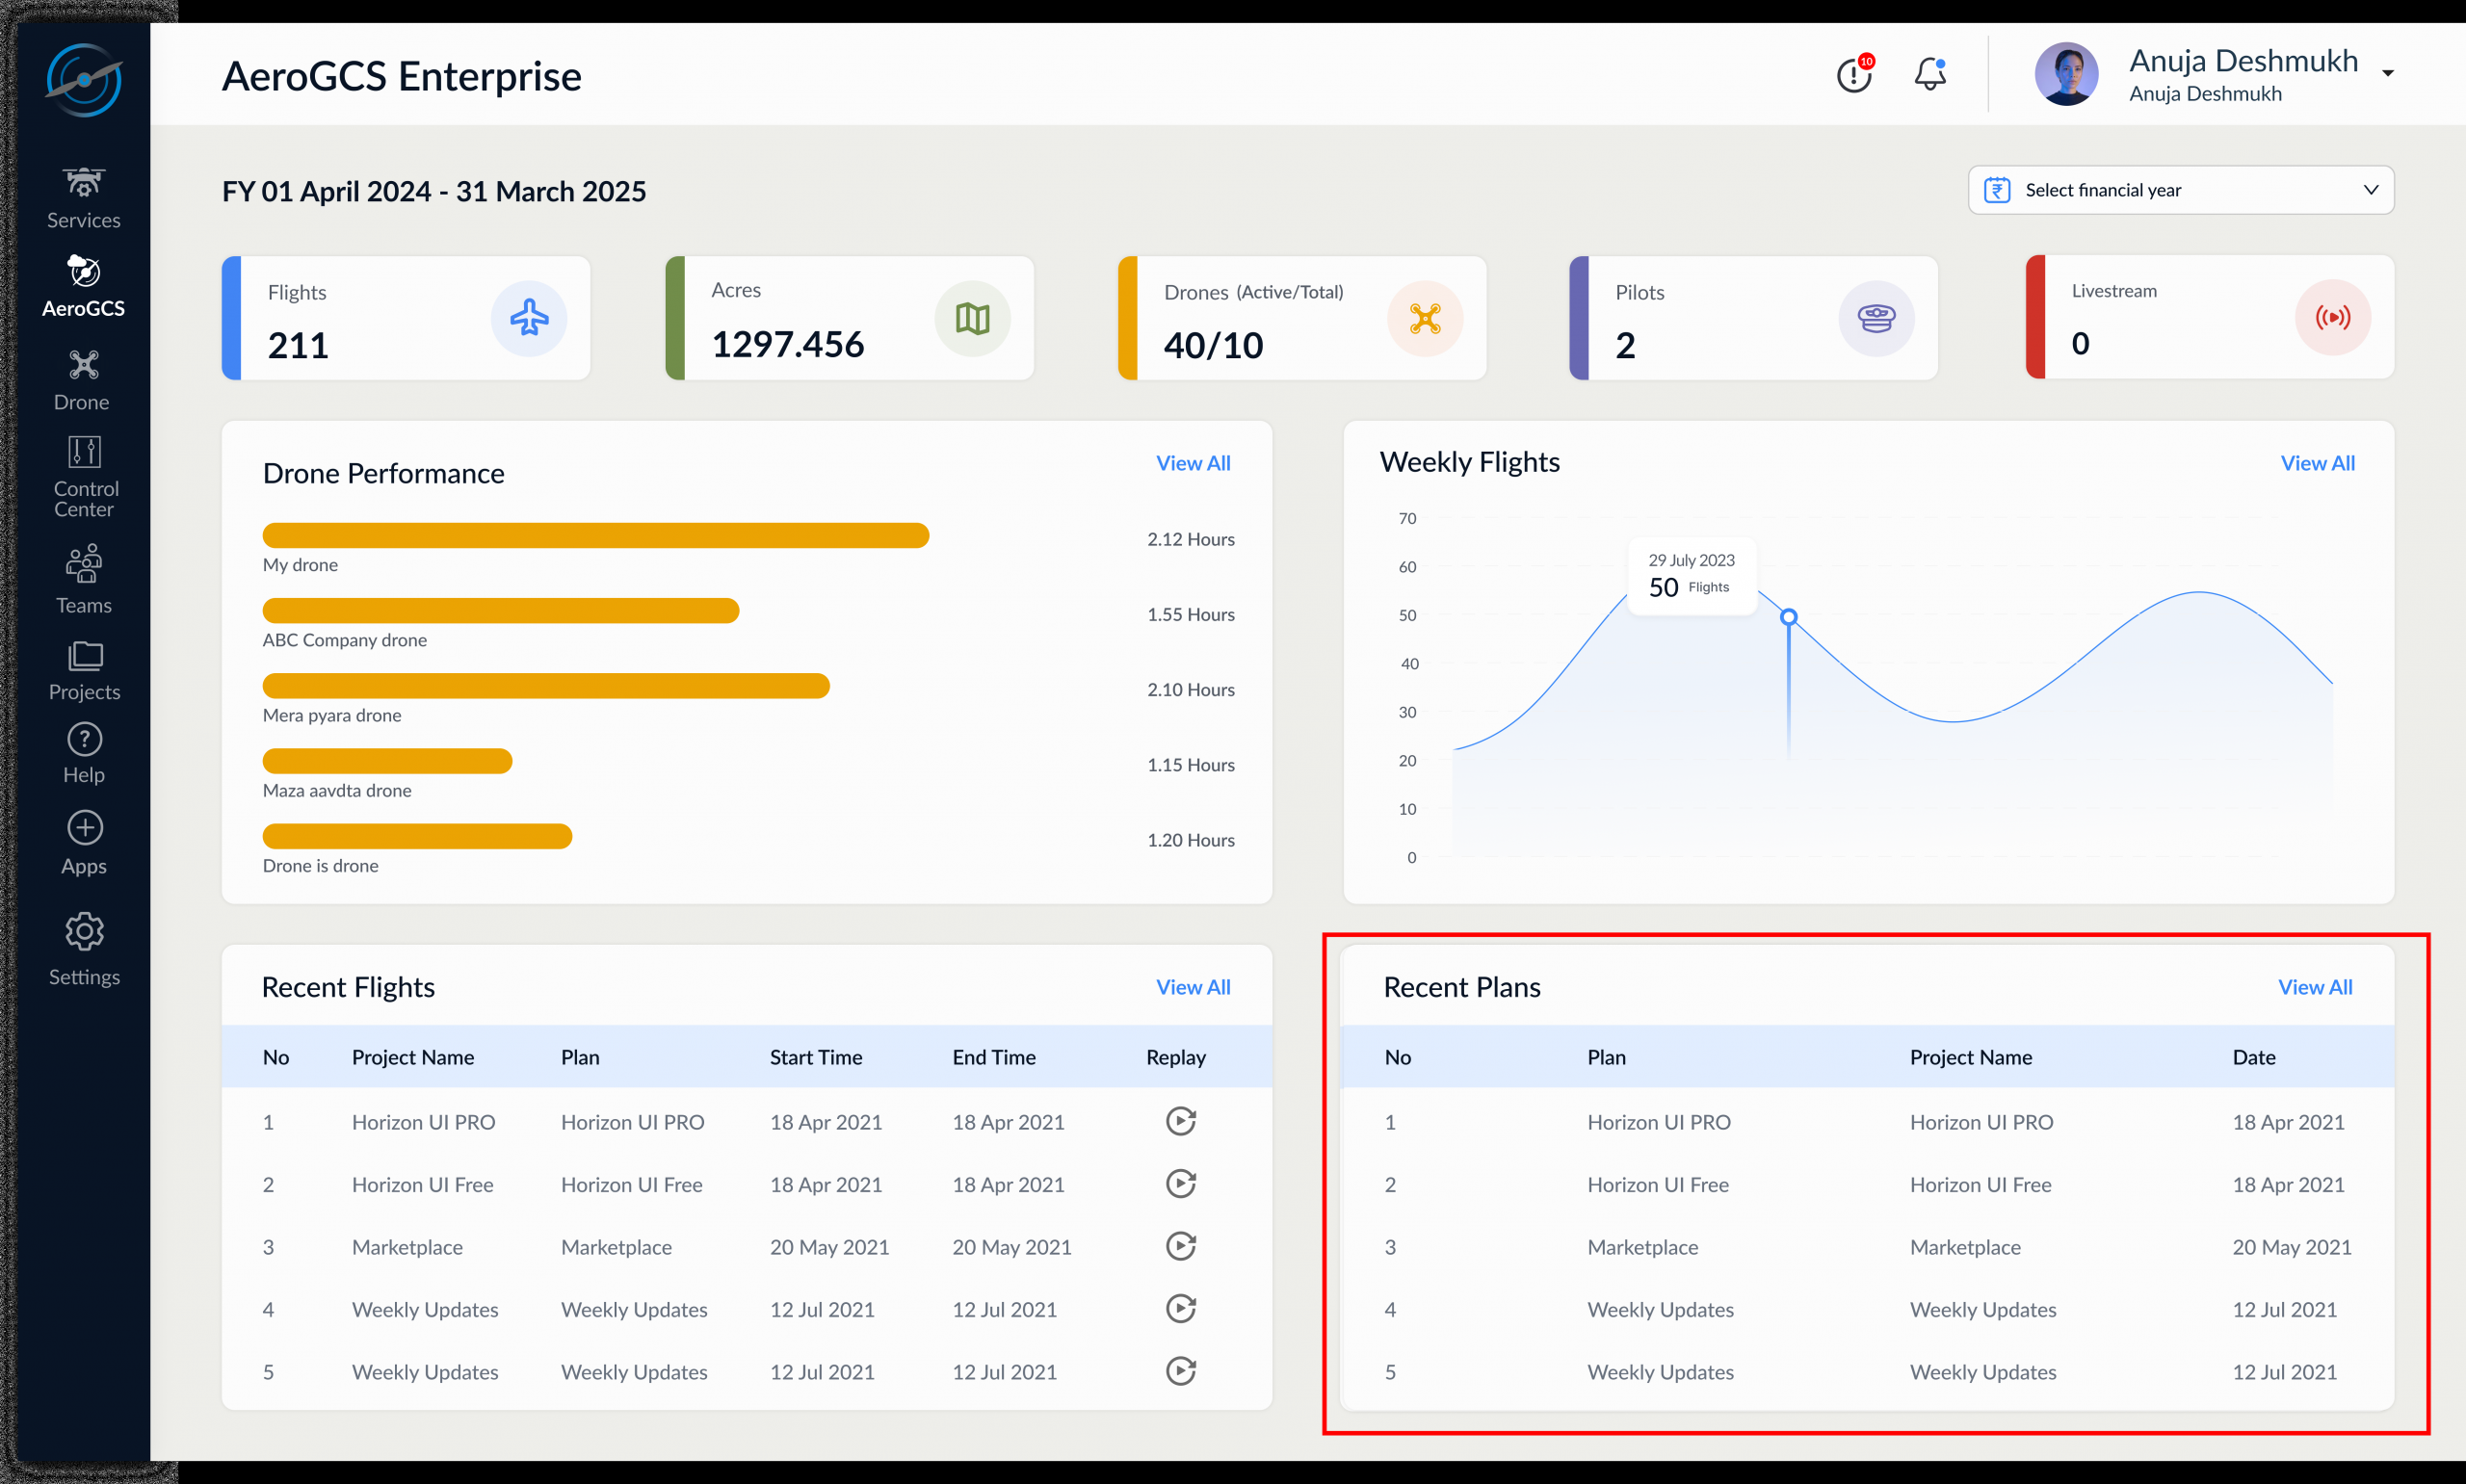
Click View All to browse the full plan history.
The Recent Plans table displays plans associated with the selected Dashboard Time Range.
4.8 Top Bar Controls
Located in the top-right corner, these icons offer access to critical system-level features.
Error Log (!)
- Icon: Black circle with white exclamation mark
- Function: Lists system warnings such as:
– Sync failures
– Device connection errors
– Mission or telemetry issues
Notifications Bell
- Icon: Standard bell with red dot for unread alerts
- Function:
– Project sync confirmations
– Flight upload success/failure
– Assignment alerts
– Subscription or billing notices
💡 Alerts are dismissible and sorted by timestamp.
User Profile Menu
- Icon: Circle with user initials/photo
- Displays: Username and organization
Options Available:
Menu Item | Description |
Switch Teams | Toggle between multiple team environments |
Settings | Manage profile info, email, and password |
Usage Statistics | View plan quota, flight count, data usage |
Logout | Exit the session securely |
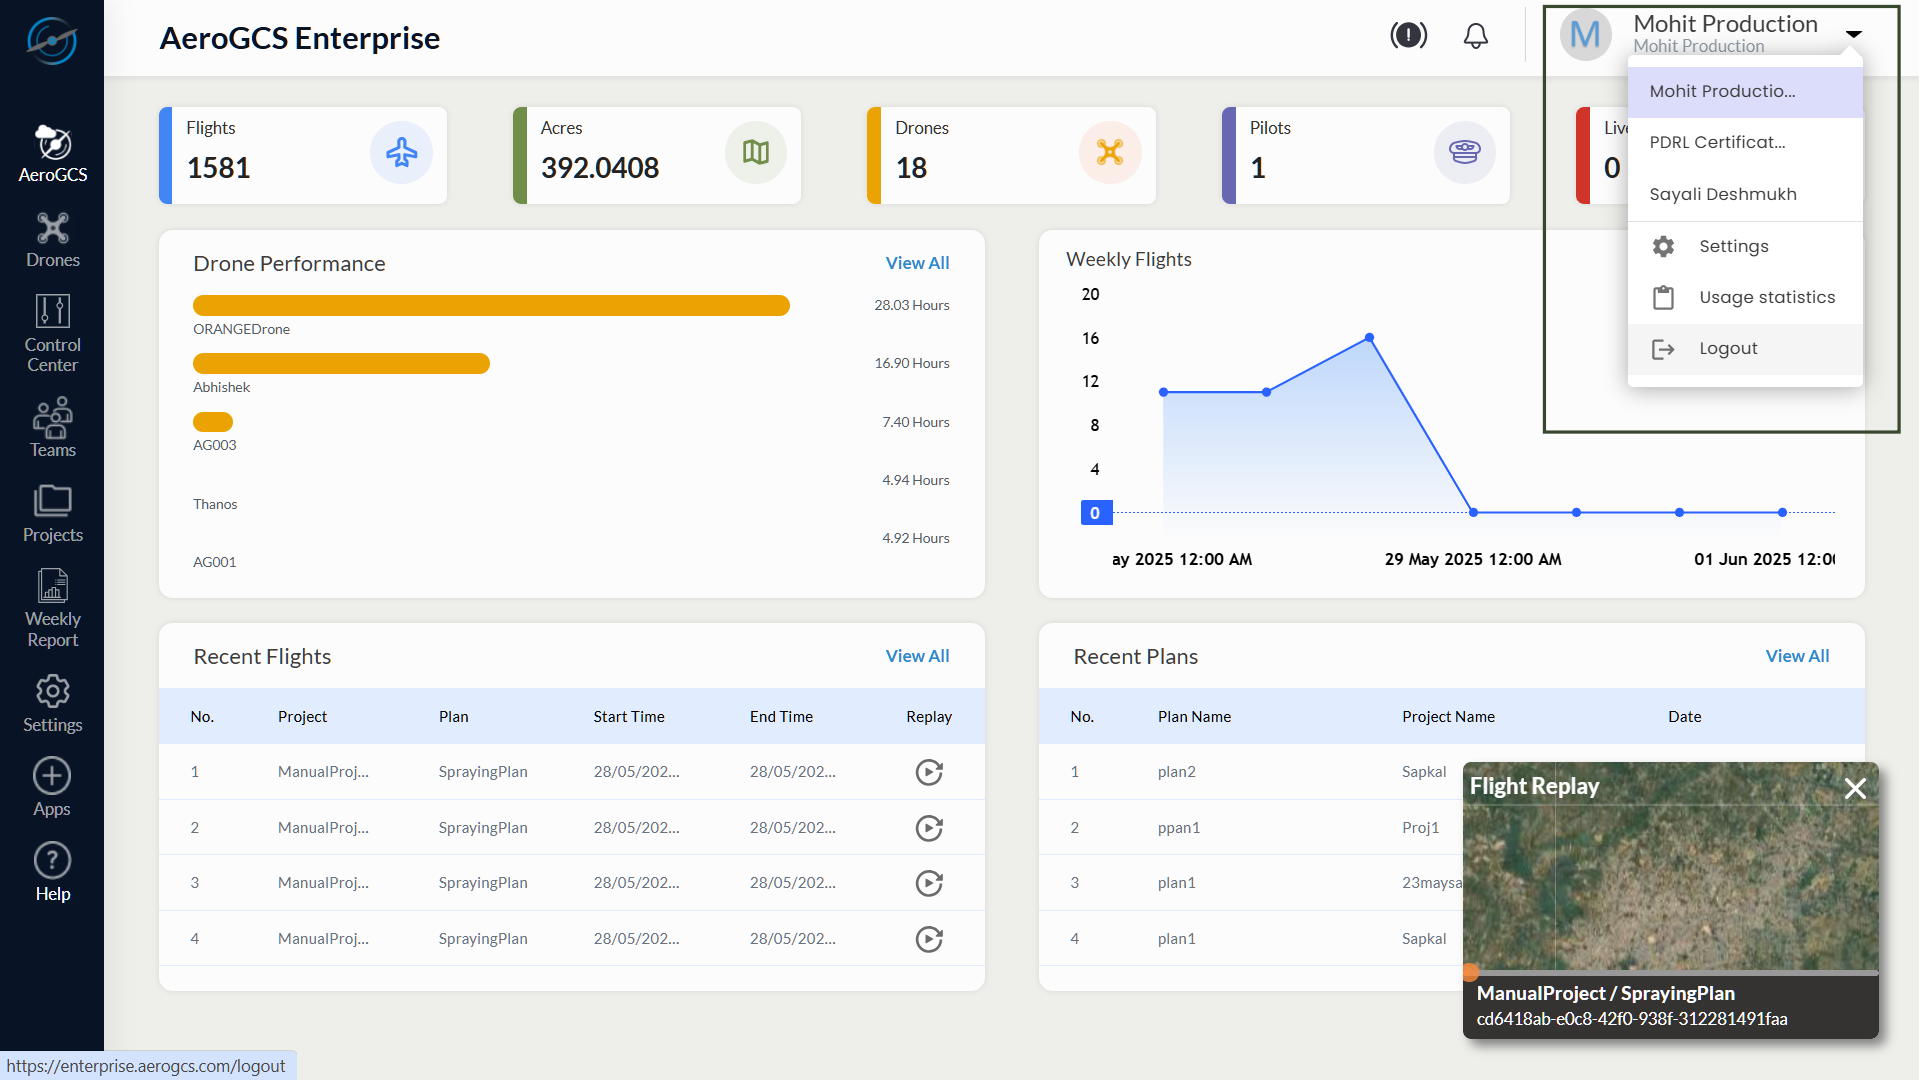
User Profile Menu
Clicking the user icon in the top-right corner opens the profile menu. This menu offers access to session-specific settings and account-level tools.
The available options are:
Switch Teams
Displays a list of teams associated with your account. Selecting a team updates the dashboard, projects, drones, and permissions based on the selected team environment.
Settings
Opens the user settings panel, where you can manage personal information, update your password, and access system preferences.
Usage Statistics
Displays key usage indicators based on your current plan, including:
- Number of registered drones
- Flight count
- Project usage
- Data storage consumed
This section helps monitor your subscription usage and plan limits by Week, Month and Year.
Select This Week, This Month or This Year to view usage statistics.

Logout
Logs you out of the current session and redirects to the login screen. It is recommended to use this option when ending a session, especially on shared systems.
Summary
The Dashboard equips users with a consolidated operational snapshot, enabling them to:
- Monitor mission volume and area coverage
- Review drone utilization and pilot activity
- Replay completed flights with full telemetry
- Access recent plans and flight logs
- Respond to alerts and manage their account environment
Whether you are a manager, operator, or analyst — the dashboard is your daily control panel for mission success.